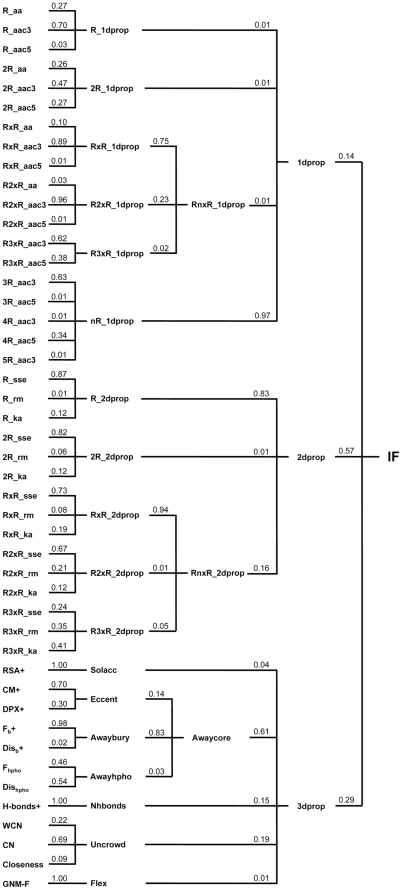
Figure 4. Classification Tree of the 46 Selected Features.
These features were selected based on their discriminatory performance for viable and inviable CPs in Dataset T. Redundant features (correlation coefficient >0.7) were screened out. The classification was done manually according to the similarities of biological meaning of these features. The purpose of this classification was to perform the hierarchical feature integration procedure developed in this work. The number following each feature abbreviation was the weight of that feature used in the hierarchical integration procedure. These weights were determined with the training Dataset T by exhaustive performance screening ( Materials and Methods ). Table S2 lists the complete meanings of the features abbreviated here.

