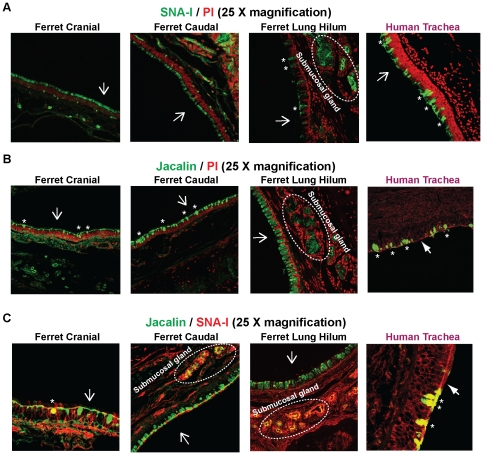
Figure 3. O linked α2–6 glycan distribution in ferret respiratory tract.
A, Staining of ferret cranial, caudal and lung hilar regions with FITC-labeled SNA-I (green). As seen from the images, SNA-I did not stain any of the goblet cells in the ferret trachea (cranial and caudal) although some of the goblet cells (marked as *) in the lung hilar region were stained by SNA-I. Submucosal glands and glycocalyx in both ferret trachea and lung hilar regions showed significant staining with SNA-I. B, Staining of ferret cranial, caudal and lung hilar regions with FITC-labeled Jacalin (green); a plant lectin having specificity to Tn antigen. Jacalin stained the goblet cells (marked as *), and the submucosal glands in all the three regions of ferret respiratory tract similar to human trachea. C, Co-staining of ferret respiratory tissue sections with FITC-labeled Jacalin (green) and SNA-I tagged to a 546 nm fluorophore (red). Co-staining is seen as yellow color due to the overlap of green (Jacalin) and red (SNA) fluorophores. Submucosal glands in both the trachea and lung hilar region showed significant co-staining with Jacalin/SNA-I. There was some co-staining of goblet cells in the ferret lung hilar region (data not shown) and in ferret trachea cranial region (marked as *). In case of staining with single lectin, the nuclei were visualized by staining with PI (red). The apical surface is marked with a white arrow.

