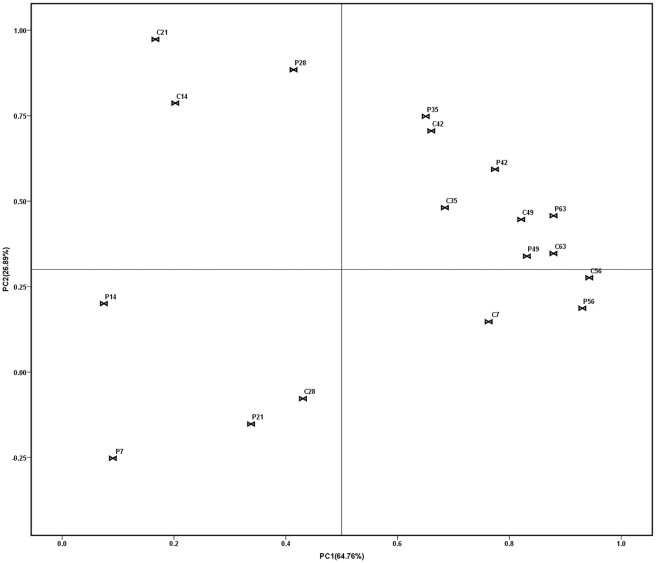
Figure 3. Principal component analysis (PCA) of T-RFLP profiles of soil samples (Hinf I).
Symbols referred to individual replicates of different treatments. “C” was on behalf of the controls amended with water, and “P” was on behalf of the treatments amended with P. fluorescens 2P24. The number (7, 14, 21, 28, 35, 42, 49, 56, 63) following the abbreviation letters “C” and “P” represented the sampling day after inoculation. Numbers in parenthesis were percentage variance explained by each principal component (PC).

