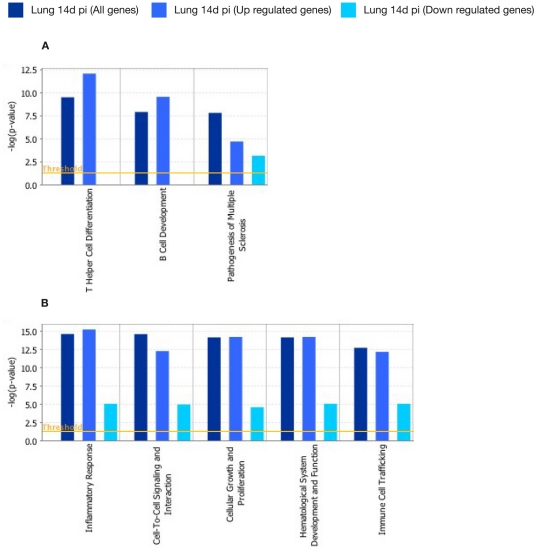
Figure 3. Functional networks (A) and canonical pathways (B) most significantly modulated in lung cells 14 days after M. bovis infection.
Visualization of the trend and significance in the regulation of each network and pathway. Dark blue: all genes represented in a network. Light blue: genes that were up-regulated in a network. Cyan: gene those were down-regulated in a network. Fisher's exact test threshold value of p≤0.05.

