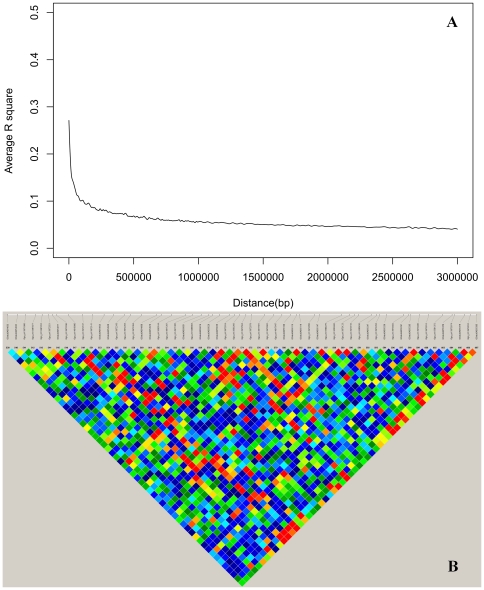
Figure 2. Linkage disequilibrium of GGA1.
A. Linkage disequilibrium pattern of the F2 population from White Recessive Rock and Xinghua chickens crossing on GGA1. B. Linkage disequilibrium between SNPs in the 1.5 Mb GGA1 region of 173.5–175 Mb. Strongest LD signals were in red and weakest LD in blue.

