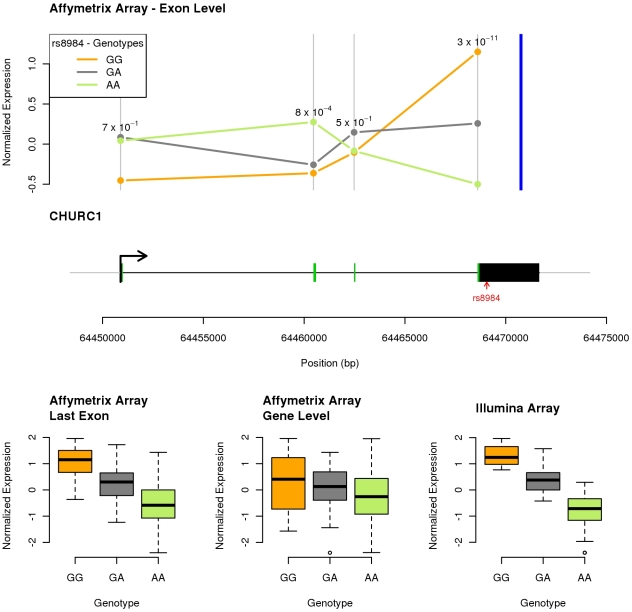
Figure 4. SNP rs8984, located within the last exon of gene CHURC1, primarily affects expression of the last exon, but is interpreted by the Illumina analysis (which has only one probe in this gene) as a gene level QTL.
For each panel, we display quantile-normalized expression levels. Data for each genotype at SNP rs8984 are repre- sented with the same color code (orange, grey and green) for all the panels. The top panel plots the mean exon expression levels along the gene as measured by the Affymetrix probes and provides on top of each exon the p-value for the association between the exon expression levels and the SNP genotypes. The blue vertical bar indicates the position of the single Illumina probe. The middle panel is a schematic representation of the gene: exons are plotted as black/green rectangles where the green color indicates coding regions. The position of SNP rs8984 is indicated by a red arrow. The bottom panel provides the box plots corresponding to each analysis: from left to right, specific Affymetrix last exon expression levels (p-value = 3×10⁻¹¹), Affymetrix gene expression levels (p-value = 0.04) and Illumina gene expression levels (p-value = 3×10⁻²⁷).

