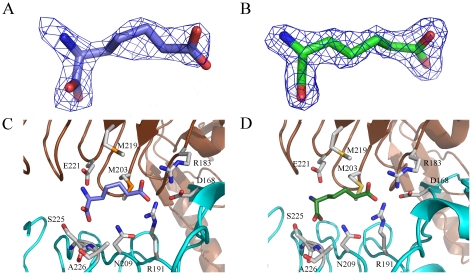
Figure 5. Ligand binding to PaDapD.
A & B: OMIT electron density maps [44] for bound ligands L-2AP (A) and D-2AP (B), contoured at 1.6σ. C & D: Interactions of L-2AP (C) and D-2AP (D) at the active site of PaDapD. The two adjacent subunits that form an active site cleft are shown in blue and brown colours. L-2AP is depicted in blue and D-2AP in green. Enzyme residues interacting with the ligands are shown in light grey.

