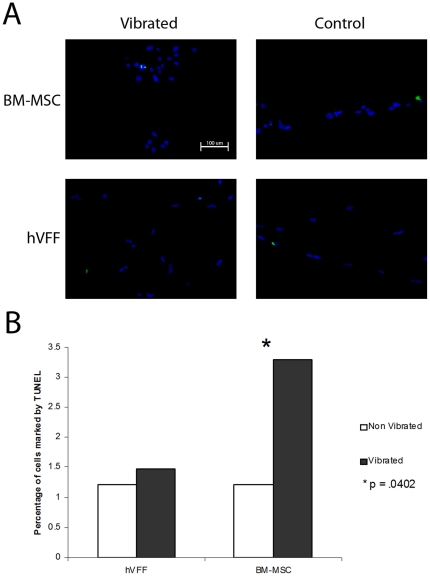
Figure 3. Apoptosis in hVFF and BM-MSC.
A. Representative 20× pictures of vibrated and control immunohistochemistry sections for each cell type. Apoptotic cells are marked by FITC (green), cell nuclei DAPI (blue). B. The percentage of proliferating cells under each condition. An increase in apoptosis is observed with vibrated BM-MSC compared to controls. * (p = .0402).

