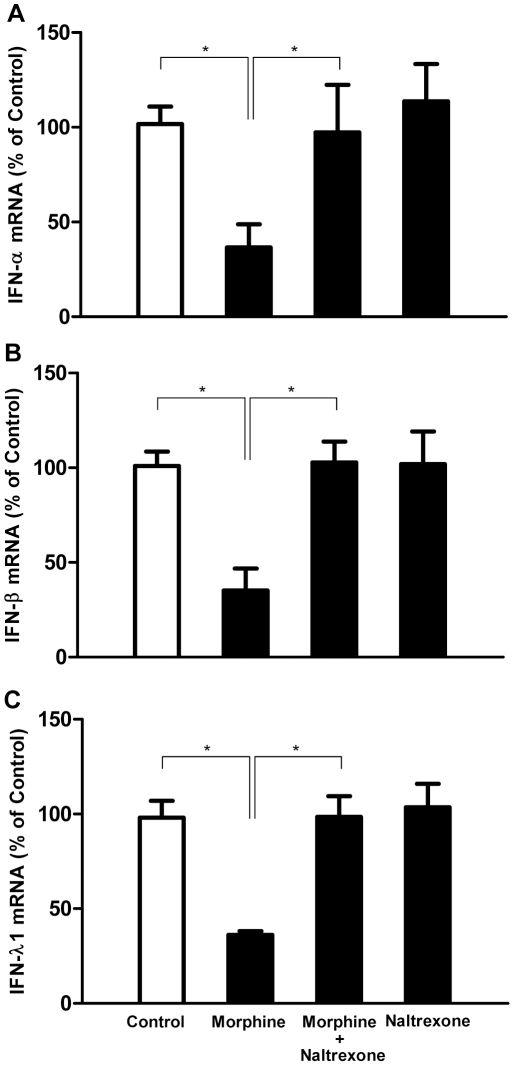
Figure 4. Effect of naltrexone on morphine-mediated down-regulation of IFNs expression.
Seven-day-cultured macrophages were incubated with or without naltrexone (10−8 M) for 1 h before treatment with or without morphine (10−10 M) for 3 h. Cellular RNA was subject to the real-time RT-PCR for IFN-α (A), IFN-β (B) and IFN-λ1 mRNA (C). Data are expressed as mRNA levels in morphine treated cells (percentage of control) those untreated cells and morphine treated cells. The results represent the mean ± SD of three independent experiments. Statistical analysis was performed using one-way analysis of variance, and significance is shown with *P<0.05 (morphine vs control or morphine vs morphine + naltrexone).

