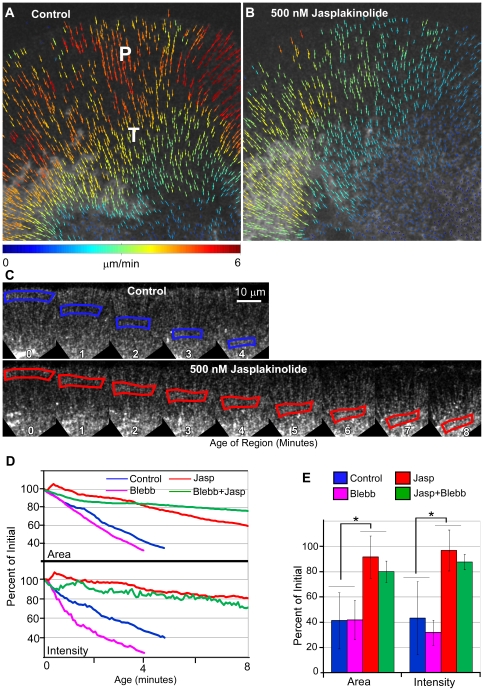
Figure 4. Jasplakinolide inhibits actin filament depolymerization and reduces convergence in the actin network independently of myosin II.
(A&B) Vector maps display the spatially averaged speckle displacement between single frame-pairs during the control period (A) and 3 minutes after 500 nM jasplakinolide addition (B). (C) Time montage of flow displaced regions during control (blue border) and 500 nM jasplakinolide treatment (red border). Age 0 for the jasplakinolide region was defined 25 seconds after drug application. The regions tracked in C are from the same growth cone analyzed in A&B. (D) Plot of change in area (top) and change in intensity (bottom) detected within the regions tracked in (C). Blue lines: control; red lines: jasplakinolide. Green lines: blebbistatin+jasplakinolide. Magenta lines: blebb. (E) Pooled data for area and intensity changes during control or drug treatments, Control: 10 regions tracked in 3 growth cones; Jasp: 7 regions from 2 growth cones. Each region was tracked over a 3 minute period during the control and beginning 90 seconds after jasplakinolide treatment. The area and total intensity in each frame was normalized to the initial value at time 0 and graphed as percent of initial values; error bars represent the standard deviation of all 6 regions. Control area and intensities were: 41.29+/−22.25% and 43.88+/−28.8%, respectively. In jasplakinolide area and intensities were: 91.66+/−16% and 96.9+/−16.2% respectively. In blebbistatin, area and intensities were: 41.9+/−15.5% and 31.9+/−9.9%, respectively. In blebbistatin plus jasplakinolide area and intensities were: 80.2+/−8.4% and 87.8+/−6.2%, respectively. Error bars are standard deviations. (*: significance level p<0.001 using a two sample Student's t test, unequal variance).

