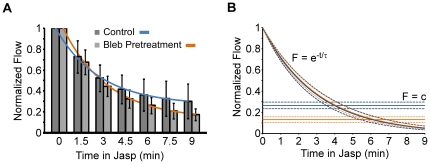
Figure 6. Decay of flow rate with time following turnover inhibition is independent of myosin II.
(A) Retrograde flow rates for vehicle control and blebbistatin pretreated growth cones normalized to rates assessed just before jasplakinolide addition. Bar graph shows average flow rates assessed by kymography. Error bars are standard deviations. Solid blue and orange lines are the curves fit to Equation 1. The adjusted R2 values of the fit are 0.9982 and 0.9991 for vehicle and blebbistatin pretreated data respectively. (B) Theoretical fit of flow decay timecourse separating the exponential decay from the offset. Solid lines indicate the curve according to the best fit parameter; dashed lines were calculated with the 95% confidence intervals which were between 2.66 and 3.40 min for vehicle and 2.82 and 3.34 min for blebbistatin pretreatment. Blue lines: control data; orange lines: blebbistatin pretreatment data.

