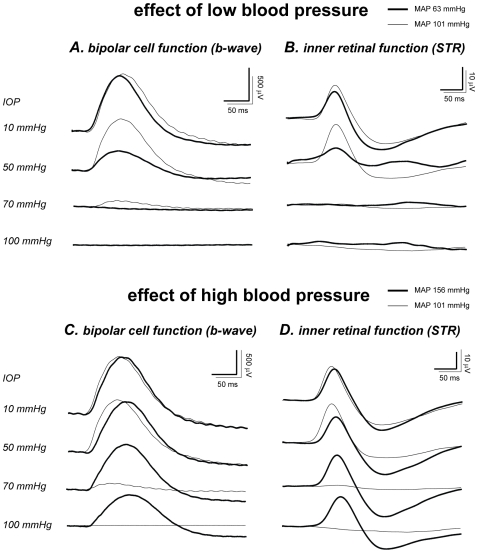
Figure 2. Effect of blood pressure on ERG waveforms during IOP elevation.
Representative ERG b-wave and STR (to −1.12 and −5.25 log cd.s.m−2 stimuli, respectively) showing the effect of low BP (A & C, thick traces, MAP 63 mmHg) and high BP (B & D, thick traces, MAP 156 mmHg) on retinal susceptibility to IOP elevation. Overlaid with the hypo- and hypertensive responses is that from a control rat with moderate blood pressure (thin traces, MAP 101 mmHg).

