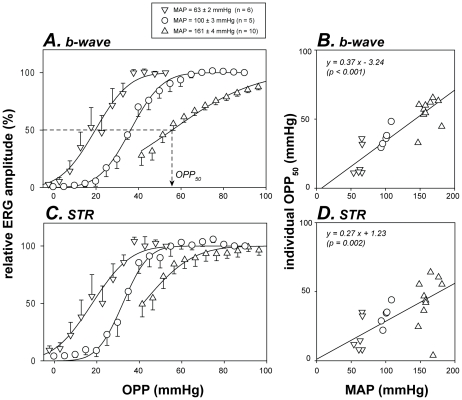
Figure 4. Relationship between retinal function and ocular perfusion pressure.
Retinal function (mean & SEM) is plotted as a function of OPP for various BP groups. Data for b-wave (A) and STR (C) are reproduced from Figures 3B and 3E respectively. Curves: cumulative normal function as per Figure 3 (Equation 1). Arrow: definition of OPP50 as the OPP for 50% functional deficit. Relationship between individual OPP50 and MAP was correlated with Deming regression (lines in B & D).

