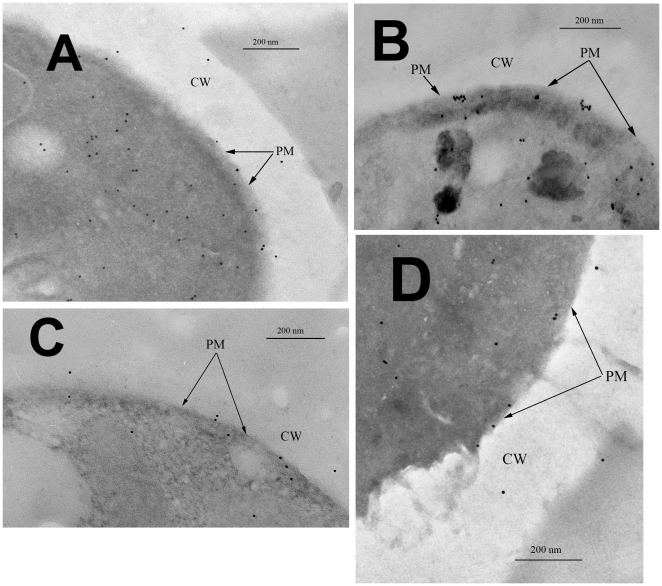
Figure 2. Immunogold labeling of Pma1 in the plasma membrane of S. cerevisiae erg6 and lcb1-100.
(A) – glucose-starved cells of the erg6 strain, Pma1 was distributed in the membrane as single structures; (B) – erg6 cells that had metabolized glucose for 15 min, Pma1 formed complexes; (C) - glucose-starved cells of the lcb1-100 strain, Pma1 was distributed in the membrane as single structures; (D) – lcb1-100 cells that had metabolized glucose for 15 min, Pma1 was distributed in the membrane as single structures. CW = cell wall; PM = plasma membrane.

