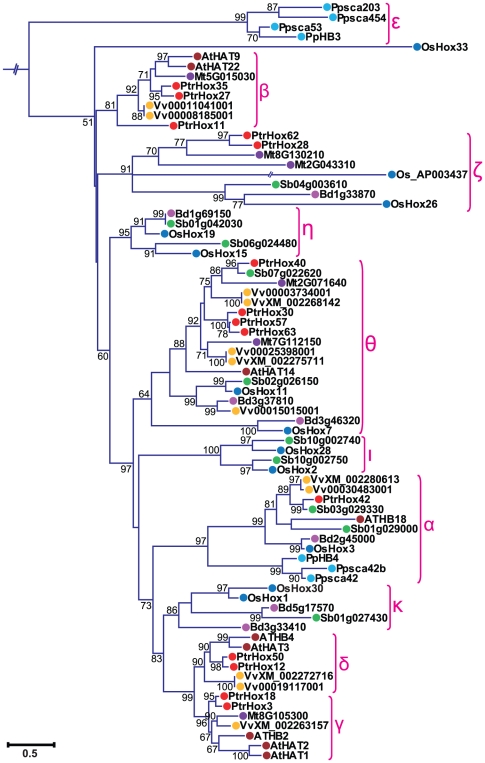
Figure 3. Phylogenetic relationship of HD-ZIP II subfamily from eight plant species.
Expanded view of the phylogeny of HD-ZIP II members from Figure 1A. The numbers at the nodes represent the bootstrap values (>50%) from 100 replicates. Scale bar indicates the estimated number of amino acid substitutions per site. Filled circles represent HD-ZIP proteins from different plant species with colors corresponding to plant taxa as indicated in Figure 1.

