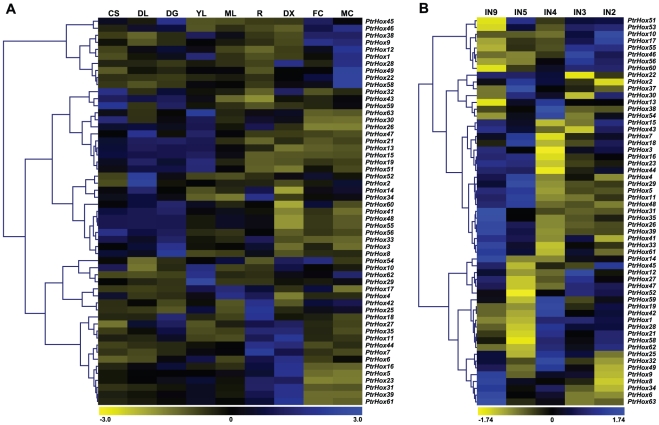
Figure 9. Expression profiles of Populus HD-ZIP genes across different tissues.
Background corrected expression intensities were log-transformed and visualized as heatmaps (see Materials and Methods). A. Heatmap showing hierarchical clustering of 54 PtrHox genes across various tissues analyzed. The Affymetrix microarray data were obtained from NCBI Gene Expression Omnibus (GEO) database under the series accession number GSE13990. CL, continuous light-grown seedling; DL, etiolated dark-grown seedling transferred to light for 3 h; DS, dark-grown seedlings; YL, young leaf; ML, mature leaf; R, root; DX, differentiating xylem; FC, female catkins; MC, male catkins. B. Heatmap showing hierarchical clustering of 57 PtrHox genes at different stem development/growth stages. The NimbleGen microarray data were obtained from NCBI GEO database under the series accession number GSE17230. IN2-IN9, stem internodes 2 to stem internodes 9. Color scale represents log2 expression values, yellow represents low level and blue indicates high level of transcript abundances.

