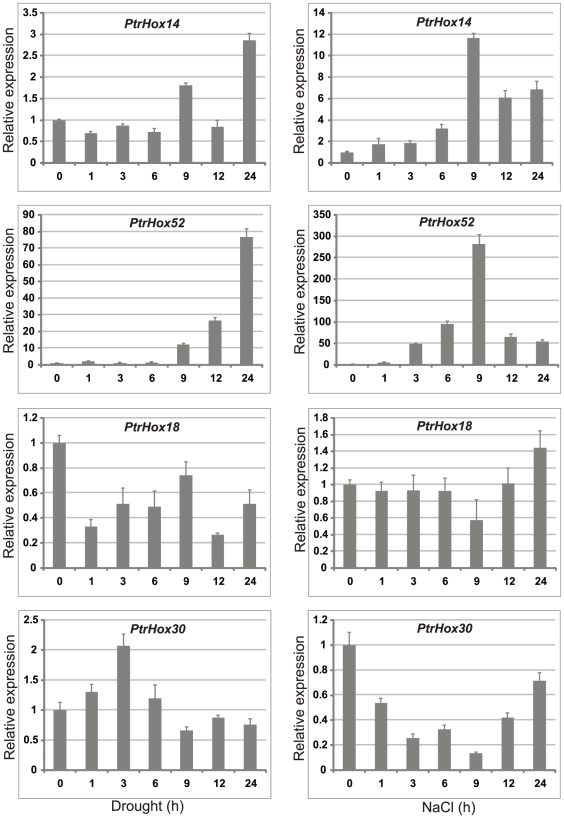
Figure 12. Expression analysis of four selected HD-ZIP genes under drought and salinity stresses using qRT-PCR.
The relative mRNA abundance of four selected HD-ZIP genes was normalized with respect to two reference genes UBQ10 and PP2a in drought and salinity stress treatments. Bars represent standard deviations (SD) of three technical replicates. X-axis is time courses of stress treatments for each gene.

