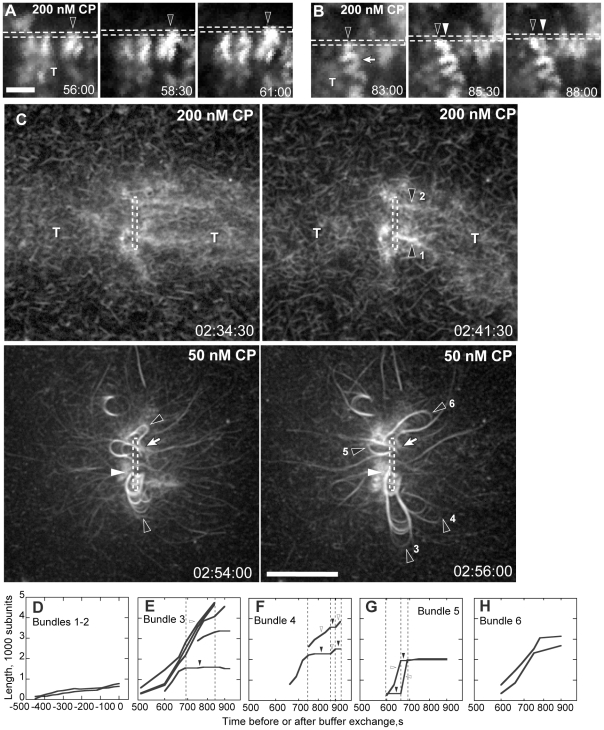
Figure 2. Filament bundles processively attach to the nanofiber.
Conditions: 8.5 µM (8 to 20% labeled) Mg-ATP actin, 9 µM profilin, 100 nM Arp2/3, and indicated CP. Nanofiber coating and buffers as in Figure 1 . (A–B) Bright filament spots grew against the nanofiber surface. Spots either remained attached to the same location on the moving nanofiber (A, black arrowhead) or oscillated back and forth along the moving nanofiber (B, blacks arrowhead). Bright spots grew faster than the surrounding comet tail network (T) and often buckled from compression between the nanofiber and tail network (arrow). White arrowhead in B indicates bundle starting position. (C) CP was lowered from 200 to 50 nM after the establishment of two comet tails (T) by motility buffer exchange. Short, bright bundles (top panels, black arrowheads) became rapidly polymerizing bundled loops (black arrowheads, bottom panels) that remained attached to the nanofiber at their growing ends (white arrowhead) and to the tail at their pointed ends (white arrows). Growing bundles splayed into filaments of different loop lengths. (D) Traces of bundles lengths over time before CP reduction. Zero seconds represents the point of buffer exchange, 163 min after the experiment start. (E–H) Traces of individual filament lengths over time after CP reduction showed that filament within each bundle grew at different rates. Plots represent filaments from the same bundle. Some filaments continuously elongated while others show pulsed growth. Scale bars are 1 µm for A–B and 5 µm for C. Times are shown in min∶sec for A–B and hr∶min∶sec for C.

