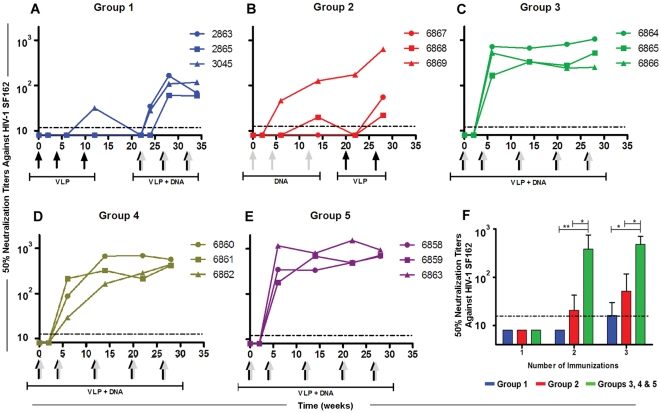
Figure 3. Neutralizing antibody responses in rabbits immunized with Env-E2 particles and DNA following different immunization regimes.
(A–E) Lines indicate NAbs versus HIV-SF162 in each rabbit in Groups 1 (blue), 2 (red), 3 (green), 4 (golden) and 5 (purple). Arrows at the bottom of each graph indicate time and type of immunization: grey arrows, DNA vaccination; black arrows, Env-E2 VLPs; combined grey and black arrows, co-administration of DNA plus E2. (F) NAb titers during priming stages for three immunization regimens: (i) Env-E2 (Group 1, in blue), (ii) DNA (Group 2, in red) and (iii) co-administration of Env-E2 plus DNA (Groups 3, 4 and 5; in green). Bars are mean titer values (+S.D.) in each group. Asterisks denote statistical significance: ** P<0.01; * P<0.05. Dotted lines indicate the limit of detection of the assays.

