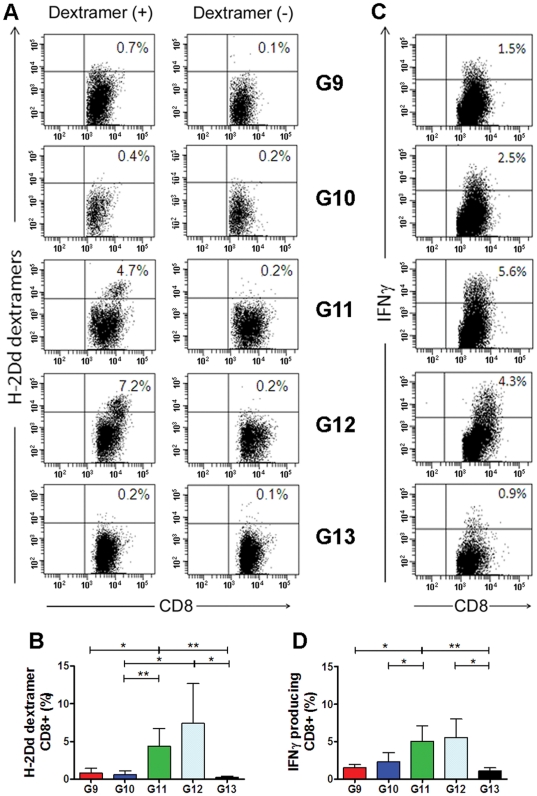
Figure 7. Cellular immune responses in mice immunized with HIV-1 Env(gp160) plasmid DNA, Env(V3)-E2 VLPs, or the combination of both.
Cellular immune responses were measured using two different assays: (i) Dextramer analysis of antigen-specific CD8+ T cells and (ii) IFN-γ intracellular cytokine staining (ICS). (A) Representative dextramer analysis results from a single individual in each group (9–13). The number in the upper right of each square represents the percentage of dextramer-positive cells after gating on CD8+ cells. (B) Mean H2Dd dextramer analysis values (+S.D.) of antigen-specific CD8+ T cells from all mice in each group (n = 3). (C) INF-γ production in CD8+ gated cells from a single representative mouse from each group. The percentages of IFN-γ positive cells are indicated in the upper right corner of each square. (D) Mean (+S.D.) of percentage values of IFN-γ secreting CD8+ T cells from all mice in each group (n = 3). Asterisks denote statistical significance: ** P<0.01; * P<0.05.

