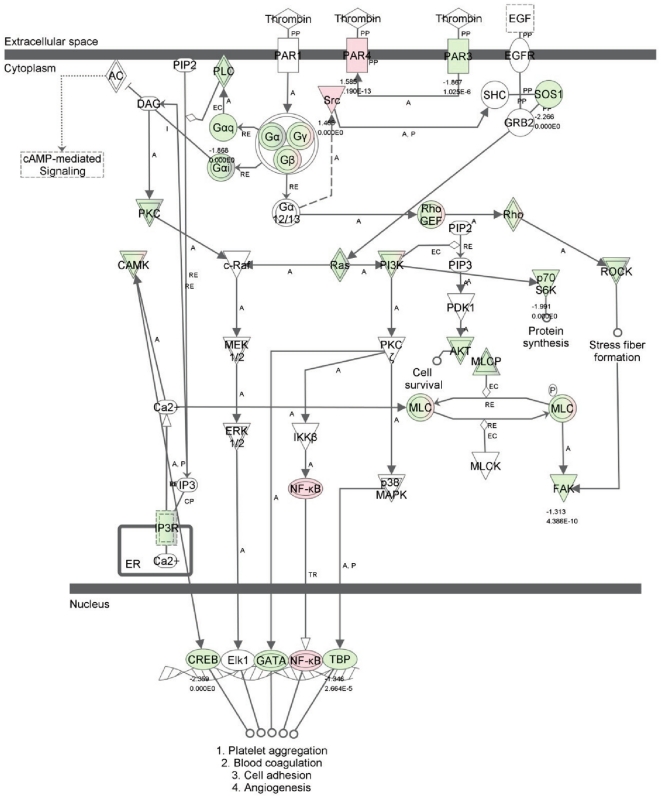
Figure 4. Display in the Thrombin Signaling pathway of those differentially expressed genes from thrombin treated HMVEC.
Thrombin Signaling pathway was constructed by Ingenuity. Those with 1.3 fold up- or down-regulated genes in our data were uploaded and displayed into this pathway. Red color indicates up-regulation of gene expression and green down-regulated genes while white indicate no change of gene expression. The detailed fold changes and full name of each gene or isoform were presented in Table S4.

