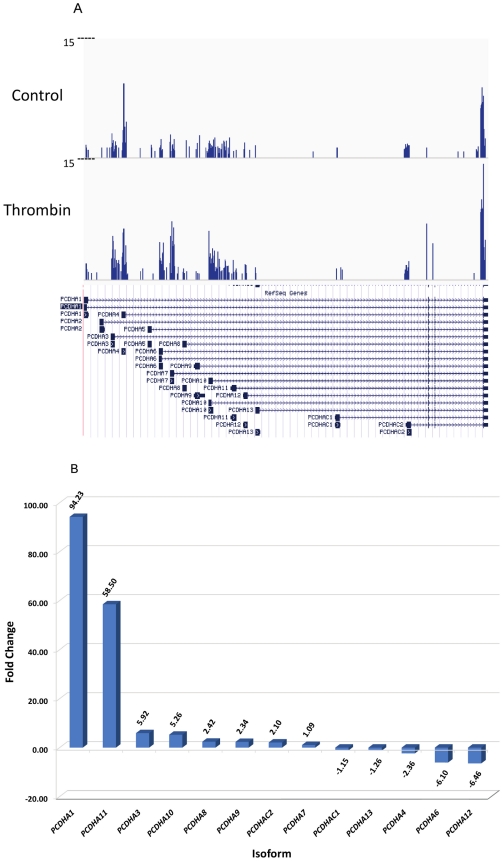
Figure 5. Protocadherin Alpha expression levels.
A. RNASeq read density aligned to the reference for PCDHA . The RNASeq read density plotted along PCDHA is shown. Average alignment was computed by igvtools. Each bar represents the frequency of reads along the gene for the combined samples. B. Histogram of Protocadherin Alpha fold changes. A histogram showing the fold changes between thrombin-treated HMVEC cells and control cells, as calculated by CuffDiff. The fold change is the ratio of FPKM of PCDHA isoforms in thrombin treated HMVEC to FPKM of those in control cells.

