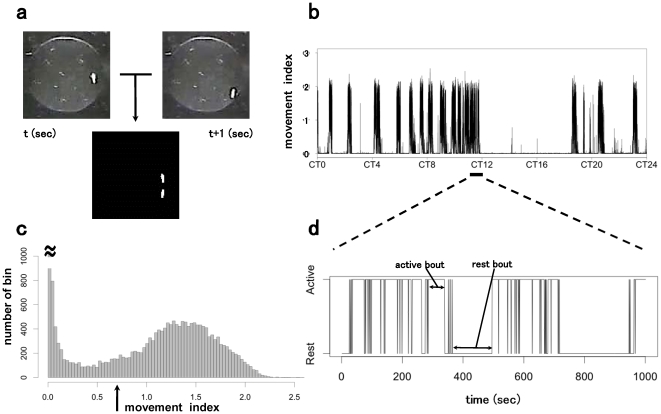
Figure 1. Movement quantification and data analysis.
a. Amount of movement was determined by the quantification of the absolute difference between consecutive images. The two images in the top row represent a single fly in a chamber at two consecutive time points. The differential image (bottom) was generated by the subtraction of these two images followed by binarization. The degree of movement was defined as the percent of suprathreshold pixels in the total number of pixels in ROIs. b. 24-h recording of the degree of movement of a single fly. c. Histogram of the degree of movement. The arrow indicates the threshold determined by the k-means clustering algorithm. d. Expanded and binarized view of b. The duration of the trace shown in this panel is indicated by the horizontal bar in Figure 1b. Each bin was classified to rest or activity according to the thresholding of the degree of movement.

