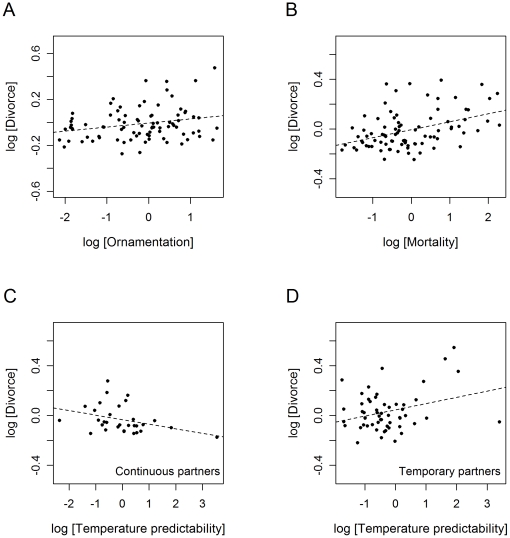
Figure 2. Partial regression plots of the statistically significant predictors of avian divorce.
Axes refer to multivariate residuals after correcting for phylogeny and the effects of other significant parameters in the model. Each data point represents one species and dotted lines depict linear trends in the relationships between variables.

