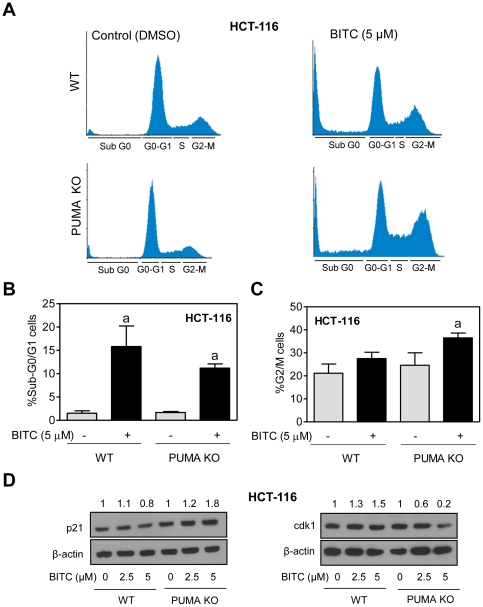
Figure 3. BITC treatment causes G2/M phase cell cycle arrest in PUMA knockout HCT-116 cells.
(A) Representative flow histograms depicting cell cycle distribution in wild-type HCT-116 cells (WT) and PUMA knockout HCT-116 cells (PUMA KO) after 24 h treatment with DMSO or 5 µM BITC. Quantitation of (B) sub-G0/G1 and (C) G2/M fraction in WT and PUMA KO HCT-116 cells after 24 h treatment with DMSO or 5 µM BITC. The experiment was repeated twice and merged data from both the experiments are shown. Data represent mean ± SD (n = 4). aSignificantly different (P<0.05) compared with DMSO-treated control by one-way ANOVA followed by Bonferroni's multiple comparison test. (D) Immunoblotting for p21 and cdk1 using lysates from WT and PUMA KO HCT-116 cells treated for 24 h with DMSO or the indicated concentrations of BITC. Each experiment was repeated at least twice.

