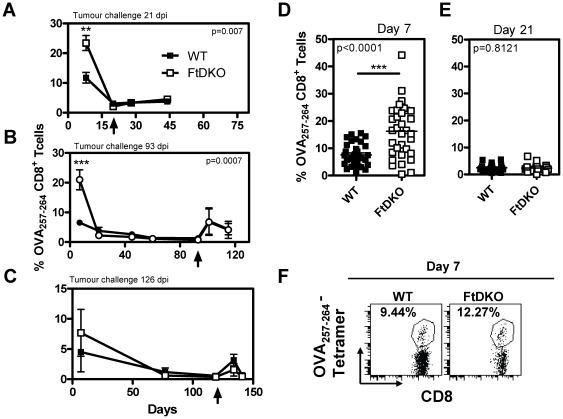
Figure 2. Frequency of OVA-CD8+ T cells following LM-OVA infection.
Mice were infected with LM-OVA and challenged with B16-OVA subcutaneously 21 days (A), 93 days (B) or 126 days (C) post-infection (dpi). Tumor injection time point is indicated by an arrow on the x axis. The mean ± SD (n = 5 per group) of the frequency of OVA257–264-specific CD8+ T cells in the blood at various times is indicated (A, B, C). The frequency blood OVA257–264-specific CD8+ T cells on day 7 and 21 after LM-OVA infection in individual animals from seven different experiments is presented (D & E). Representative profile of blood OVA257–264-specific CD8+ T cell percentages (F). Response on day 7 is statistically different between the two mouse strains by two tailed, unpaired t test with Welsh's correction for unequal variance; **, P<0.001, ***, P<0.0001.

