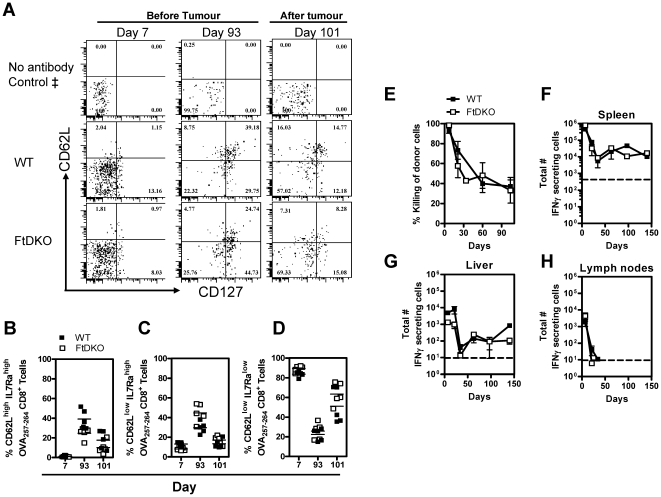
Figure 3. Phenotype and functionality of OVA-CD8+ T cells.
C57BL/6J (WT) and FtDKO mice were immunized intravenously with 104 LM-OVA. Representative flow cytometric profile indicating the expression of CD62L and IL-7Rα on OVA257–264-specific CD8+ T cells on day 7 and 93 and 101 (8 days after tumor challenge) after infection (A). ‡, Fluorescence minus one (FMO) controls was used to set the gates for IL-7Rα and CD62L. ‘No antibody control’ indicates gating strategy based on acquisition of cells stained with anti-CD8 antibody and OVA257–264 tetramer but not IL-7Rα or CD62L antibody. The frequency of TCM (B), TEM (C), and TE (D) of individual replicates at the various time points are shown as a percent of all OVA257–264-specific CD8+ T cells. At different time points after infection an in vivo CTL assay was performed in representative mice (n = 3 mice per time point per group), (E). Frequency of IFN-γ producing OVA257–264-specific CD8+ T cells in the spleen (F), liver (G) and inguinal lymph nodes (H) at different time points after infection is shown. Data in panels F–G represent Mean ± SD of triplicate ELISPOT wells of n = 2 mice per group. This experiment was repeated 3 independent times with similar results.

