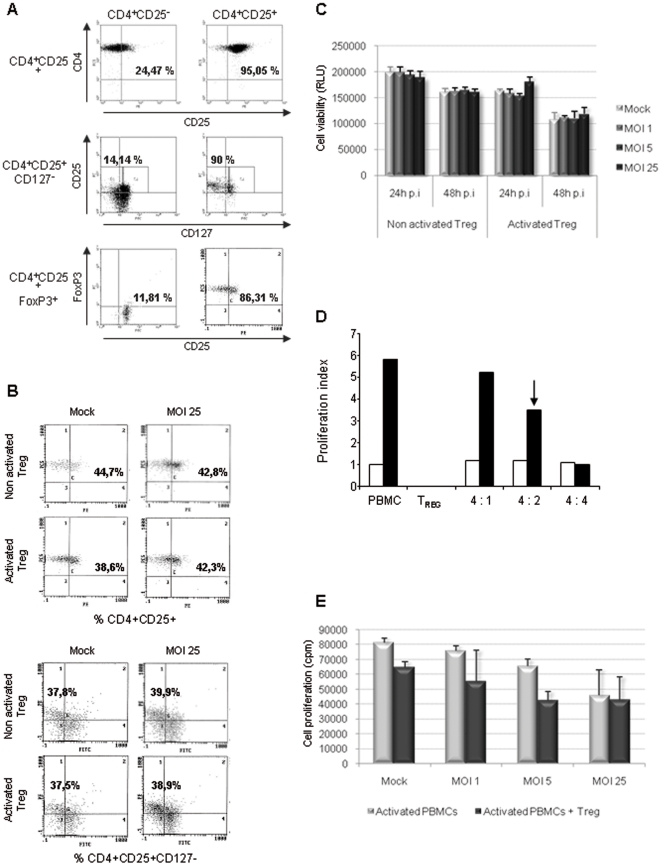
Figure 7. H-1 PV affects neither Treg cell phenotype nor viability while inhibiting their suppressive activity.
Treg cells were inoculated with increasing amounts of purified H-1 PV or mock-treated. MOI : multiplicity of infection, expressed as the number of plate-forming unit/cell; p.i : post-infection. A. Control of Treg cell purity. Cells were labelled for Treg cell markers and analyzed using flow cytometry. Results are expressed as percentages of CD4+CD25+, CD4+CD25+CD127- and CD4+CD25+FoxP3+ cells within the whole cell population. B. Treg cells do not undergo any major phenotypical changes upon infection. Cells were labelled for Treg cell markers and analyzed using flow cytometry 48 h p.i. Results are expressed as percentages of CD4+CD25+ and CD4+CD25+CD127- cells within the whole cell population. C. H-1 PV does not affect Treg cell viability. Cell viability was assessed 24 and 48 h p.i using a bioluminescent test measuring ATP amount in living cells. Results are represented as means of triplicate wells with ± standard deviation bars and expressed in relative light unit (RLU). D. Ex vivo Treg cells are able to suppress autologous activated PBMCs proliferation. Autologous PBMCs were activated (anti-CD3 and -CD28 antibodies) and cultured with increasing quantities of Treg cells. PBMCs proliferation was assessed by metabolic incorporation of tritiated thymidine into cellular DNA 48 h p.i. Results are represented as means of triplicate wells with ± standard deviation bars and expressed in count per minute (cpm). The black arrow indicates the ratio chosen for further experiments. E. H-1 PV is able to inhibit Treg cell suppressive activity. Autologous PBMCs were activated (anti-CD3 and -CD28 antibodies), cultured with Treg cells (4 PBMCs for 2 Treg cells) and mock- or H-1PV-treated. PBMC proliferation was assessed by metabolic incorporation of tritiated thymidine into cellular DNA 48 h p.i. Results are represented as means of triplicate wells with ± standard deviation bars and expressed in count per minute (cpm). Representative data from 3 independent experiments.

