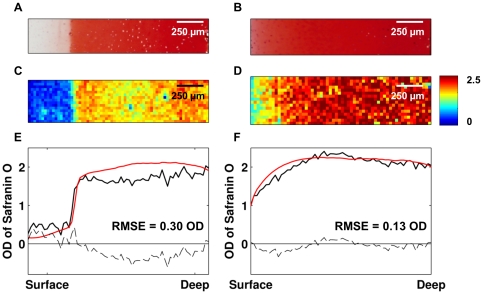
Figure 6. An enzymatically degraded (left) and a normal (right) sample.
Safranin O –stained sections are shown in A and B. Predicted PG contents by the PLSR model are shown in C and D. The loss of superficial PGs is easily seen in C. Depthwise distribution profiles of the same samples analyzed by the PLSR model (black) and by digital densitometry (red) are shown in E and F. The difference between the predicted and measured values are marked with dashed lines in E and F. RMSEs were 0.30 OD and 0.13 OD for the enzymatically modified sample and intact sample, respectively.

