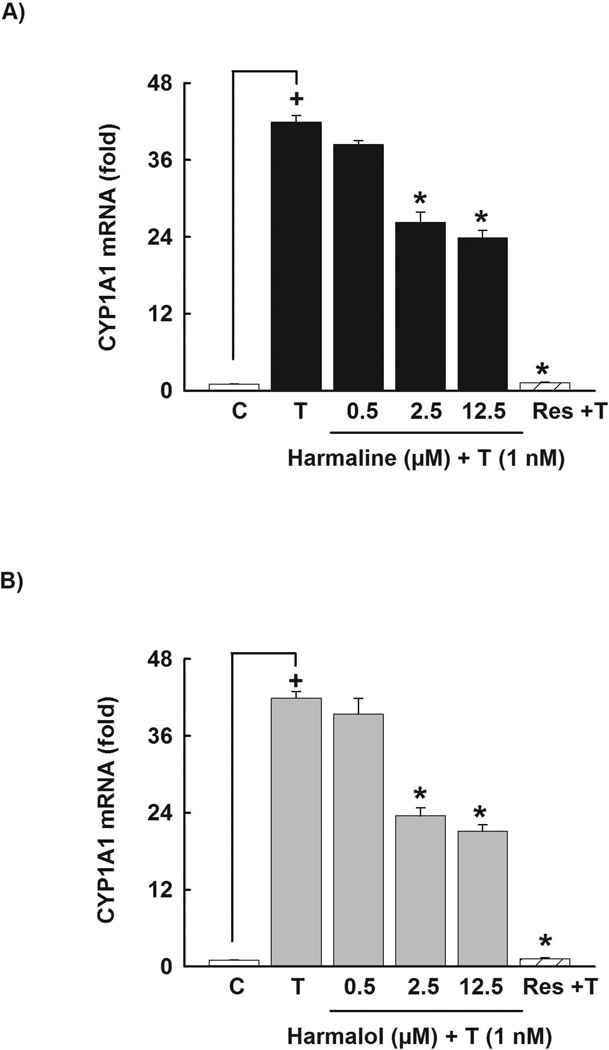
Figure 3. Effect of harmaline and harmalol on CYP1A1 mRNA in HepG2 cells.
Cells were pre-incubated with increasing concentrations of harmaline (A) or harmalol (B) for 30 min before the addition of TCDD (1nM) for an additional 6 h. The amount of CYP1A1 mRNA was quantified using real-time PCR and normalized to β-actin housekeeping gene. Resveratrol (Res, 12.5 µM) was used as a positive control. Values represent the mean of fold change ± S.E.M. (n=4). (+) P < 0.05 compared with control (C), (*) P < 0.05 compared with TCDD (T).

