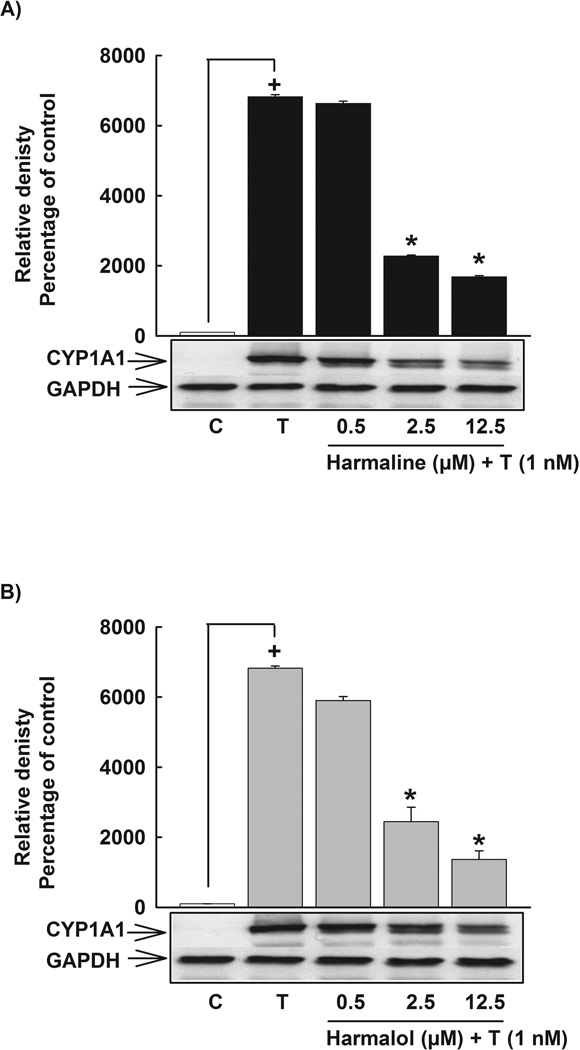
Figure 4. Effect of harmaline and harmalol on CYP1A1 protein in HepG2 cells.
Cells were pre-incubated with increasing concentrations of harmaline (A) or harmalol (B) for 30 min before the addition of TCDD (1nM) for an additional 24 h. Protein was separated on a 10% SDS-PAGE and CYP1A1 protein was detected using the enhanced chemiluminescence method. The intensity of bands was normalized to GAPDH signals, which was used as loading control. One of three representative experiments is shown. (+) P < 0.05 compared with control (C), (*) P < 0.05 compared with TCDD (T).

