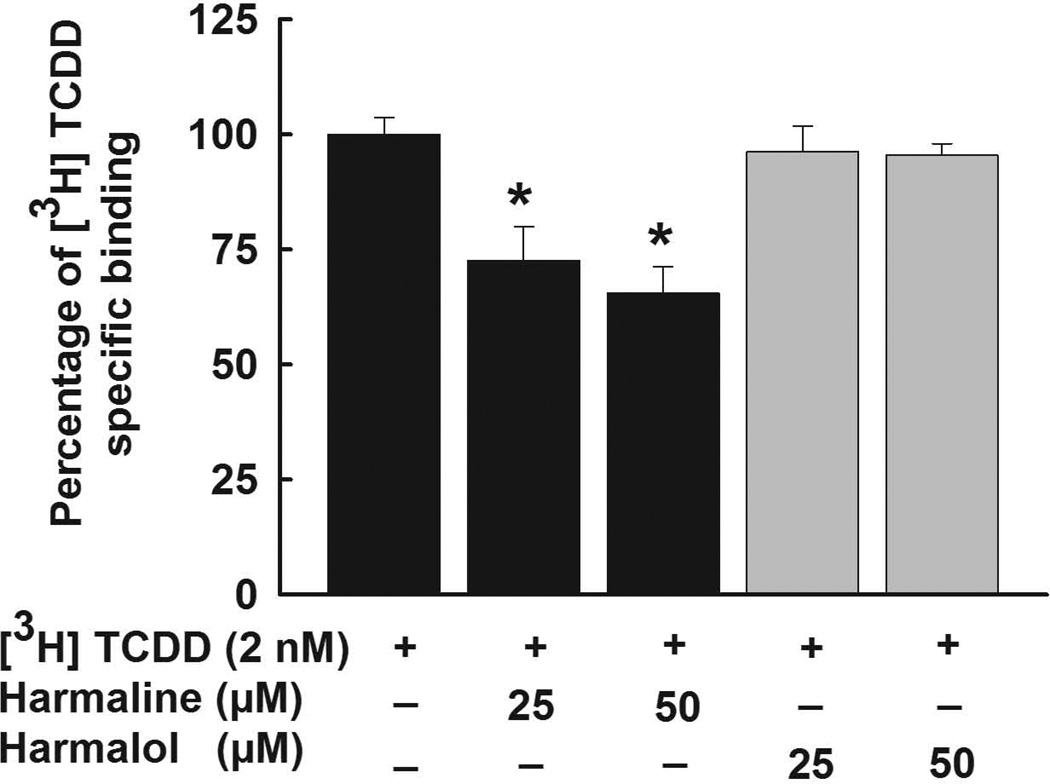
Figure 8. AhR ligand binding ability of harmaline and harmalol.
Untreated guinea pig hepatic cytosol (2 mg/mL) was incubated with [3H]-TCDD (2 nM) alone (total binding), [3H]-TCDD (2 nM) and TCDF (200 nM, 100-fold excess of competitor, nonspecific binding), or [3H]-TCDD (2 nM) in the presence of increasing concentrations of harmaline or harmalol (25, and 50 µM) and the samples analyzed by the hydroxyapatite assay as described under Material and Methods. Values were adjusted for nonspecific binding and expressed as % specific binding relative to the absence of a competitor ligand. Values are presented as the mean ± S.E.M. (n = 9). (*) P < 0.05 compared with [3H]-TCDD.

