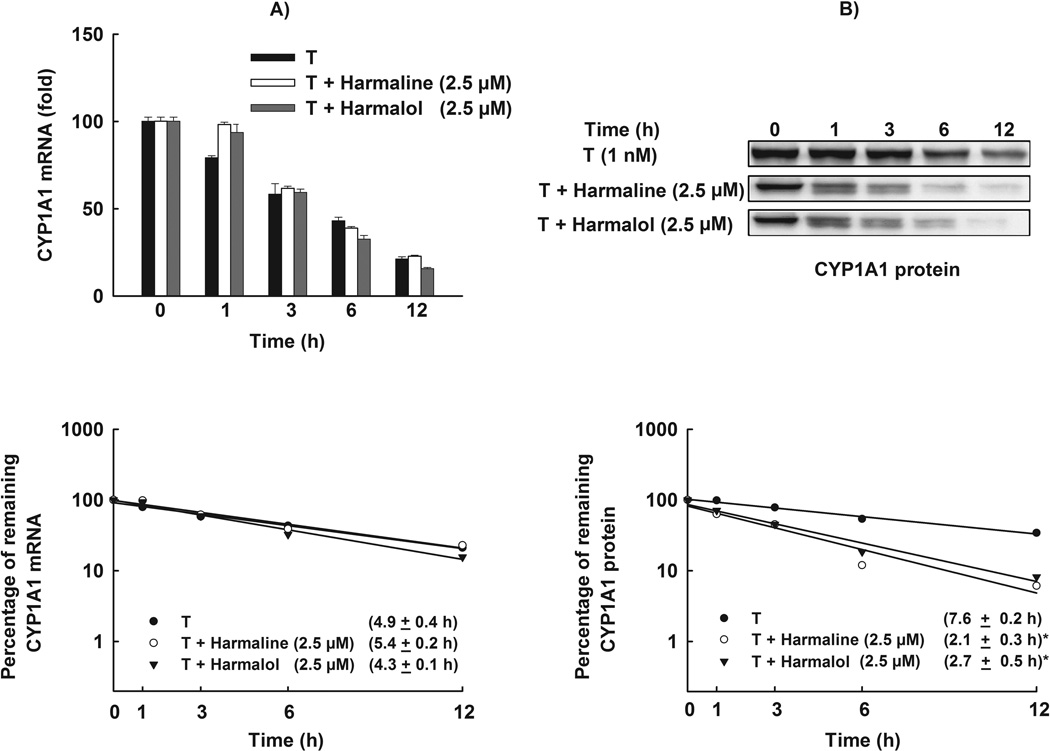
Figure 9. Effect of harmaline and harmalol on CYP1A1 mRNA and protein stability.
HepG2 cells were treated with TCDD (1 nM) for 6 h for mRNA stability and 24 h for protein stability assays. Thereafter, the cells were washed and incubated with fresh media containing harmaline (2.5 µM) or harmalol (2.5 µM) plus Act-D (5 µg/mL, the mRNA synthesis inhibitor) or CHX (10 µg/mL, the protein translation inhibitor). (A) Total RNA was extracted at 0, 1, 3, 6 and 12 h after incubation with harmaline or harmalol and subjected to real-time PCR. (B) Protein was separated on a 10% SDS-PAGE and CYP1A1 protein was detected using the enhanced chemiluminescence method. The intensities of CYP1A1 protein bands were normalized to GAPDH signals, which were used as loading controls (data not shown). mRNA and protein decay curves were analyzed individually, and the half-life was estimated from the slope of a straight line fitted by linear regression analysis (r2 ≥ 0.85) to a semilog plot, expressed as a percent of treatment at time = 0 h (maximum, 100%) level, versus time. The half-lives obtained from three independent experiments were then used to calculate the mean half-life (mean ± S.E.M., n = 3). (*) P < 0.05 compared with TCDD (T).

