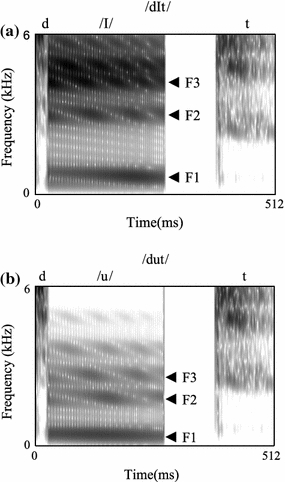
Fig. 1.

Spectrograms of two syllables differing only in their vowels. This figure shows spectrograms of two synthetic syllables: /dIt/ and /dut/. It is clearly visible that formant frequencies differ between the vowels with lower formant frequencies in /u/ compared to /I/. F1, first formant; F2, second formant; F3, third formant; kHz, kilohertz; ms, milliseconds
