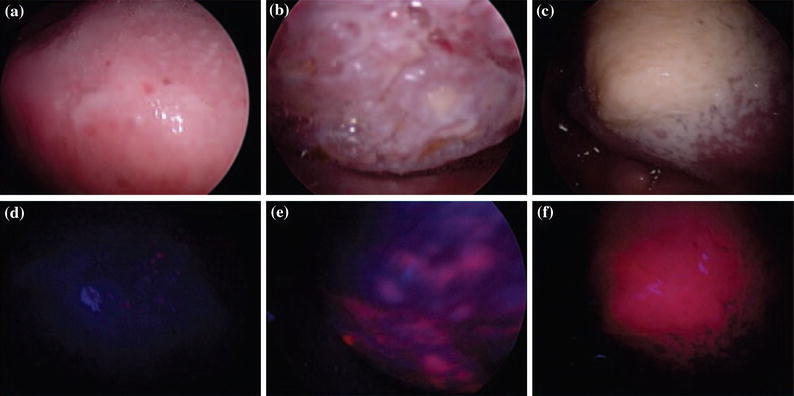
Figure 5.

White-light and HY-induced fluorescence images of normal (a, d), hyperplastic (b, e) and SCC tissues (c, f). Progressive increase in I R/I B ratio can be seen from normal to hyperplastic to SCC lesions (Reproduced with permission of British Journal of Cancer 88.)
