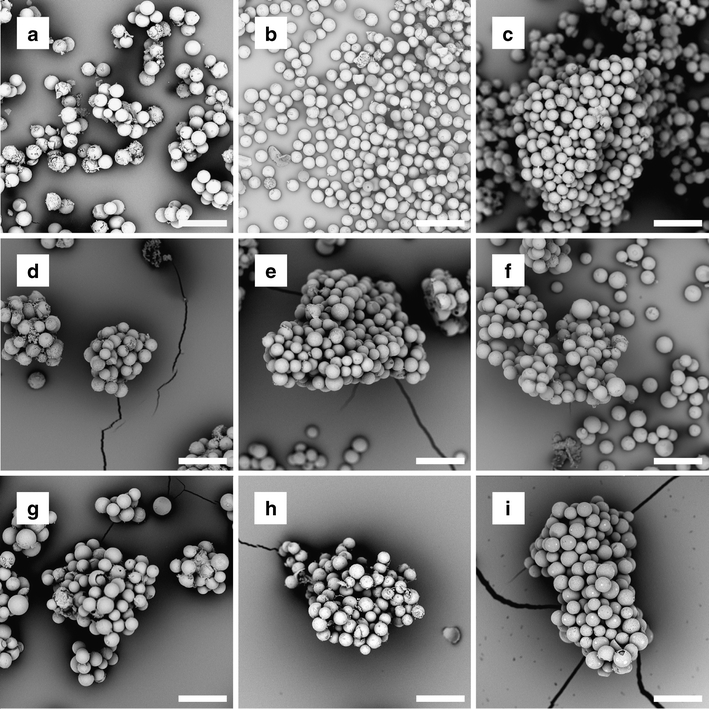
Fig. 2.

Scanning electron micrographs of HoAcAcMS and 166HoAcAcMS after incubation for different times in phosphate buffer. (a–c) HoAcAcMS, (a) after 1 month, (b) after 3 months and (c) after 6 months of incubation. (d–f) 166HoAcAcMS neutron irradiated for 3 h at a neutron flux of 5 × 10¹² n cm−2 s−1 (d) after 1 month, (e) after 3 months and (f) after 6 months of incubation. (g–i) 166HoAcAcMS neutron irradiated for 6 h at a neutron flux of 5 × 10¹² n cm−2 s−1 (g) after 1 month, (h) after 3 months and (i) after 6 months of incubation. The magnification in all images is 1000x, the bar represents 50 μm.
