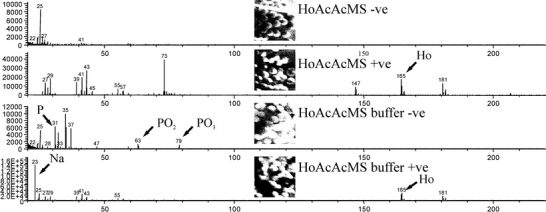
Fig. 3.

TOF-SIMS spectra from control HoAcAcMS (HoAcAcMS) and buffer incubated HoAcAcMS (HoAcAcMS buffer). The micrographs show total ion count images in the negative (−ve) and the positive (+ve) secondary ion mode. The peaks of interest are indicated with an arrow.
