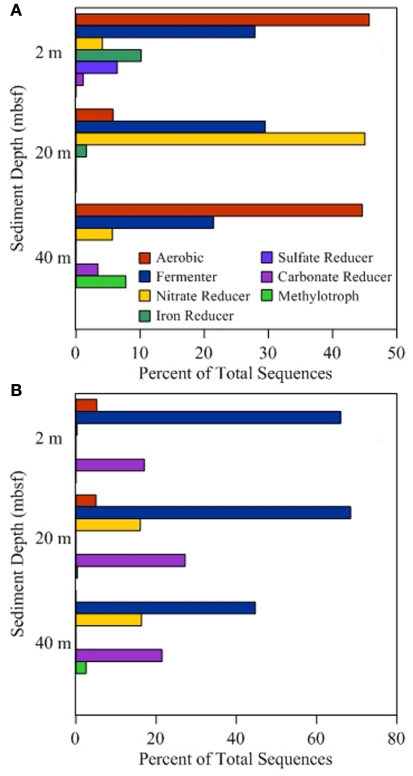
Figure 3.
Functional group distribution. Sequence annotation at the genus level was used to identify functional groups associated with different metabolic processes. Lineages associated with multiple processes were placed in multiple categories to avoid assumptions of activity. Percentages presented for onshore samples (A) and offshore samples (B) are based on the total number of sequences obtained and are independent of percentages reported for other categories.

