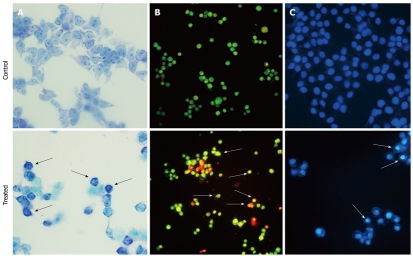
Figure 2.
Morphological changes in the Mz-ChA-1 cells after exposure to different concentrations (0 μg/mL and 10 μg/mL) of ESC-3 for 48 h. A: Morphological changes visualized under an ordinary inverted phase-contrast microscope with Giemsa staining (magnification 400 ×); B: Morphological changes visualized under fluorescence microscope with AO/EB staining (magnification 200 ×); C: Morphological changes visualized under fluorescence microscope with Hoechst 33258 staining (magnification 400 ×). The arrows indicate the cells undergoing apoptosis. AO/EB: Acridine orange/ethidium bromide.

