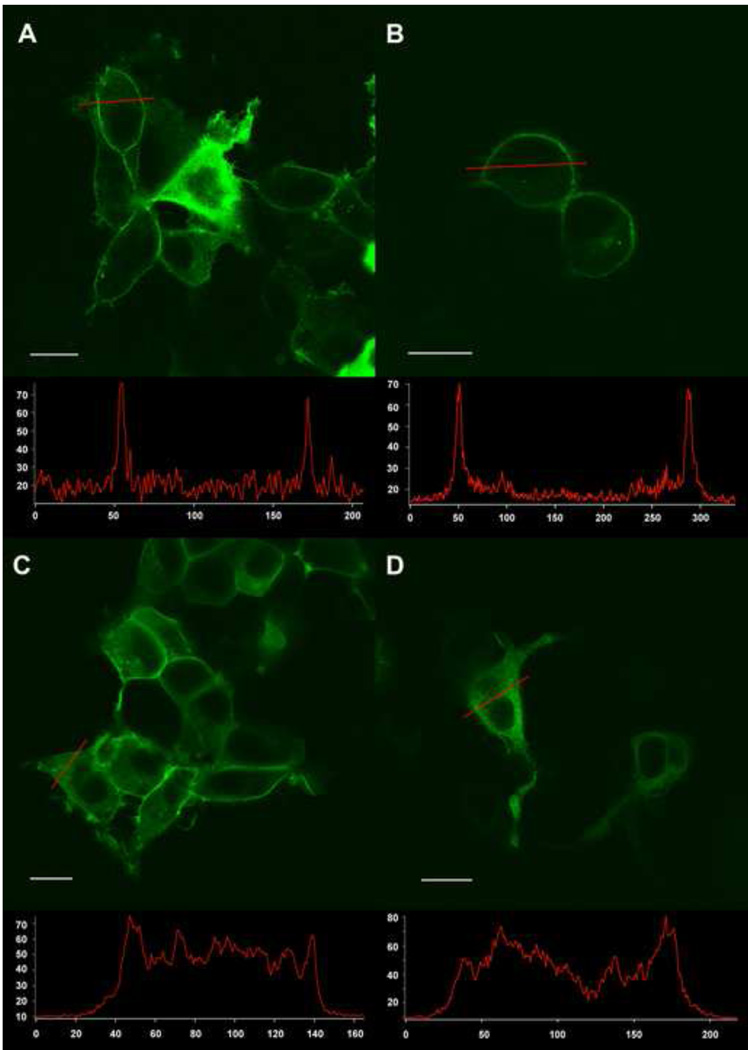
Figure 4. Examples of the location of fluorescence expression in images taken with a confocal microscope.
A) Type 1: A1fB5r in HEK294 cells, mainly membrane fluorescence; intracellular fluorescence in over expressing cells. B) Type 1: A1fF7r in NIE115 cells, mainly membrane expression . C) Type 2: A1fA1r in HEK293 cells, both membrane and intracellular fluorescence. D) Type 3: E7fF7r in HEK293 cells, mainly intracellular fluorescence. The white line in each panel is the scale bar of 10 µm. Bottom inserts: line scan data from individual cells demonstrate the relative intensity between the plasma membrane and the cytosol. The x-axis is pixel number. The y-axis is fluorescence intensity (arbitrary units).

