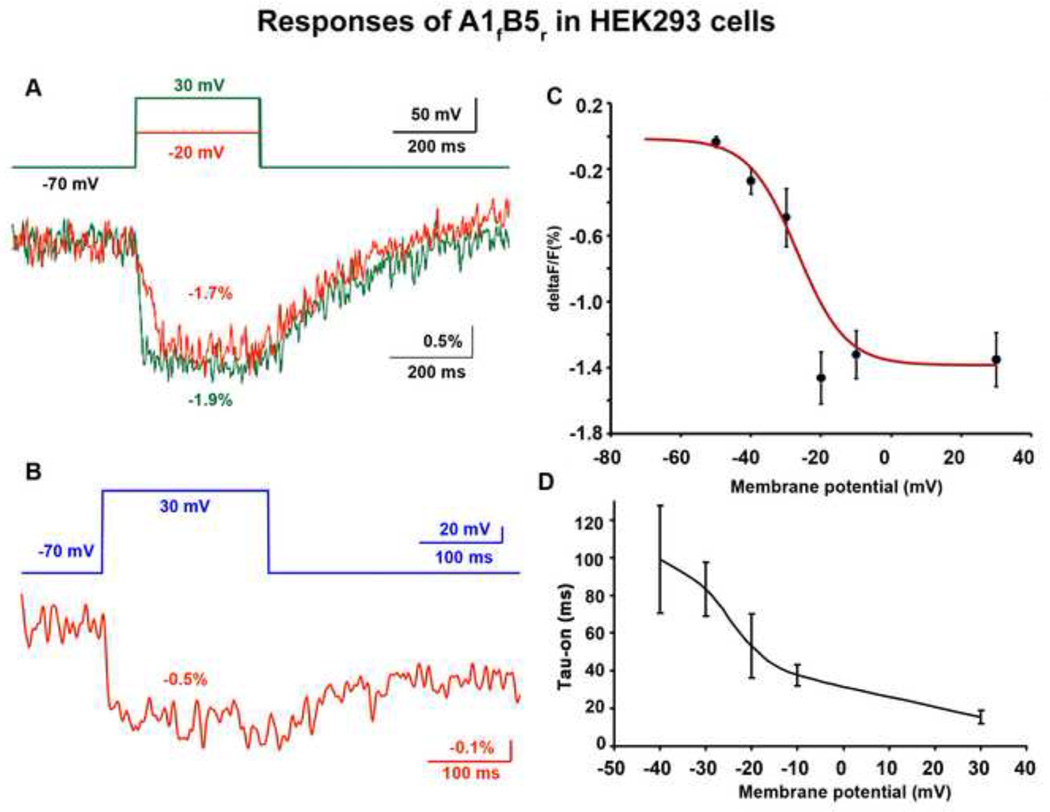
Figure 5. A1fB5r’s fluorescence signal in response to depolarization in HEK293 cells.
A) An example of A1fB5r’s fluorescence changes upon depolarizations of 50 mV and 100 mV, and their recovery after the repolarization. The optical traces were smoothed with five passes of a binomial low pass filter. B) An example of incomplete fluorescent recovery after the repolarization. The optical trace was smoothed with a 60 Hz Gaussian low pass filter. Ten trials were averaged for both A and B. C) ΔF/F of A1fB5r versus membrane potential. The numbers of cells used for each data point: −50 mV: 10, −40 mV: 7, −30 mV: 4, −20 mV: 5, −10 mV: 16, 30 mV: 12. D) On time constant of A1fB5r versus holding potentials from −40 mV to 30 mV. The numbers of cells used for each data point: −40 mV: 5, −30 mV: 3, −20 mV: 5, −10 mV: 16, 30 mV: 12.

