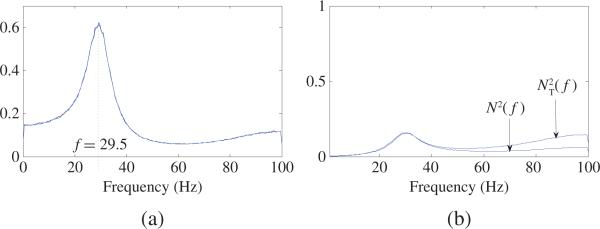
Fig. 14.
(a) Power spectra of X1, X2, X3. It can be seen that X1, X2, X3 have almost same powers across all frequencies and have an obvious peak at f = 29.5 Hz. (b) based on (44) and NT(f) = NX3→X1 (f) based on the estimated AR model of the pair (X1, X3). One can see that NT(f) (i.e., the total causality from X3 to X1) is very close to N(f) (i.e., summation of causalities along all routes from X3 to X1) before 40 Hz. But after 40 Hz, N(f) > NT(f). For a general model, the exact relationship between N(f) and NT(f) is not known.

