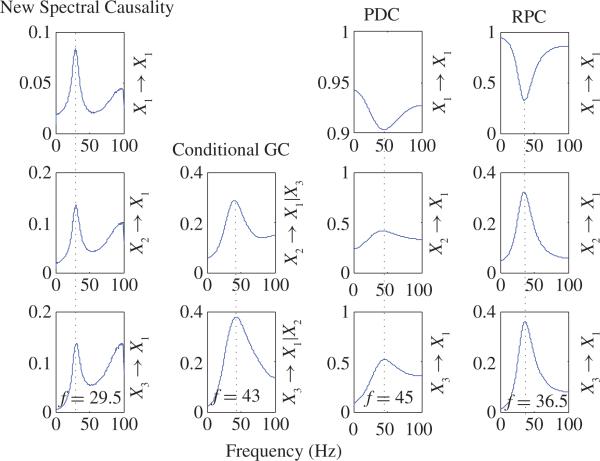
Fig. 15.
Comparison among new spectral causality, conditional spectral GC, PDC, and RPC together. The first, third, and fourth columns show direct new spectral causality, PDC, and RPC, respectively, from X1 to X1, from X2 to X1, and from X3 to X1. The second column shows conditional GC. It is notable that: 1) new spectral causality from X1 to X1, from X2 to X1, and from X3 to X1 are similar and have peaks at the same frequence of 29.5 Hz, which is consistent with the peak frequency of power spectra [see Fig. 14(a)], and 2) conditional GC, PDC, and RPC (from X2 to X1, and from X3 to X1) have peaks at different frequencies which are all different from 29.5 Hz.

