
Figure 2.
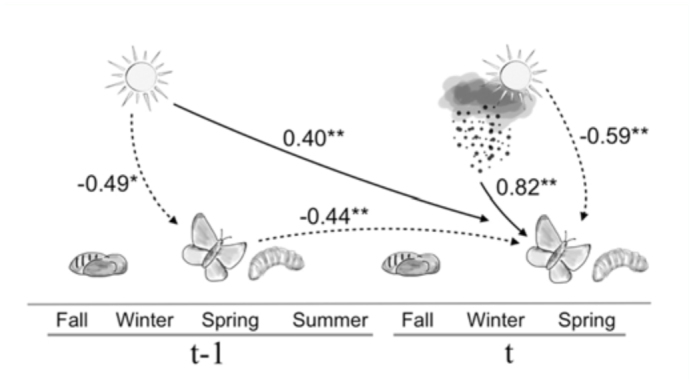
(a) Illustration of Glaucopsyche lygdamus life cycle (relative timing of adult, larval, and pupal stages) and path model relating change in adult abundance at time t (relative to the previous year) to the following weather variables: winter average daily maximum temperature in year t-1; winter precipitation as well as winter average daily minimum temperature in year t. Adult abundance at t-1 is the count of individuals in each spring, while variation in abundance in year t is expressed as ΔN, or the change in abundance from t-1 to t (see text for more details). Path coefficients are shown with dashed lines for the negative coefficients (*p < 0.05; **p < 0.01). R2 for Nt-1 and ΔN in this model are 0.25 and 0.81, respectively. Also, see Table 1 for results from a multiple regression model including the same variables. High quality figures are available online.