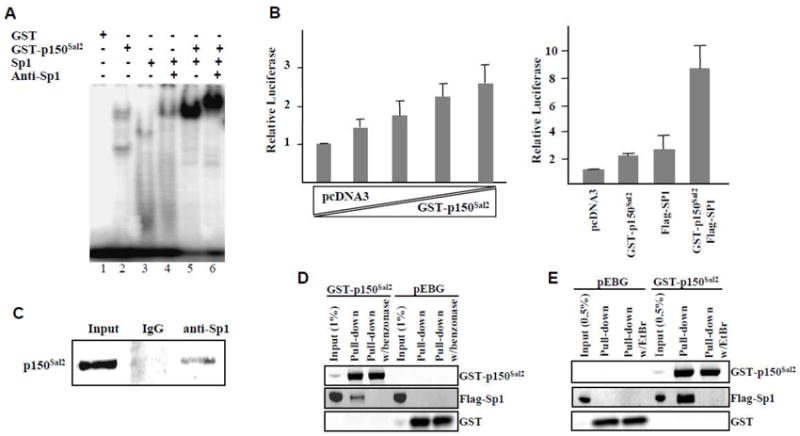
Figure 4. DNA binding and activation by p150Sal2 and Sp1.

A – Binding of p150Sal2 and Sp1 to end-labeled Sp1 oligonucleotide by EMSA and supershift with anti-Sp1. B – Left: Relative activity of Sp1-luciferase reporter in HeLa cells transfected with increasing amounts of GST- p150Sal2 and decreasing amounts of empty vector. Right: Relative luciferase activity with empty vector, GST-p150Sal2, Flag-Sp1 or both. Vector DNA was added as needed to equalize total amounts of DNA. pTL-Renilla was used to normalize for transfection efficiencies. Results are mean ± .S.D. of three experiments measured 36 hours after transfection. C – Co-immunoprecipitation of endogenous p150Sal2 with anti-Sp1 in HOSE cells and blotting with anti-p150Sal2. D and E – HOSE cells were transfected with Flag-Sp1 and empty GST vector or GST-p150Sal2. Extracts prepared 36 hours post-transfection were analyzed by GST pull-downs either directly (C), after benzonase treatment to digest DNA (D), or after incubation with ethidium bromide (EtBr) to unwind DNA (E).
