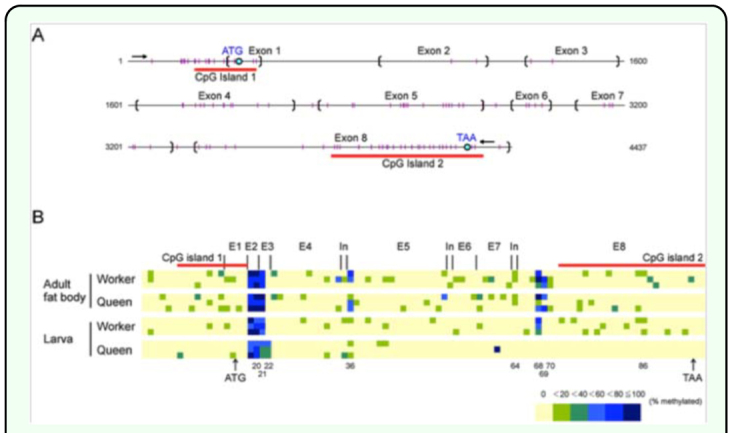
Figure 2.

Structure and methylation pattern of the Apis mellifera Hex110 gene. (A) Genetic structure of Hex110. The analyzed region is indicated by a set of arrows. The parentheses represent the exonintron boundaries. The small vertical lines indicate individual CpG sites. The CpG islands were identified with a CpG Island Searcher algorithm (http://www.uscnorris.com/cpgislands2/cpg.aspx) with the following criteria: a GC content of at least 50%, a ratio of observed-to-expected CpG frequency of at least 0.6, a region length of 200 bp, and a gap between adjacent islands of at least 100 bp. (B) CpG methylation map of Hex110. All CpG sites within the analyzed region are shown in three replicates for each group. E, exon. In, intron. High quality figures are available online.
