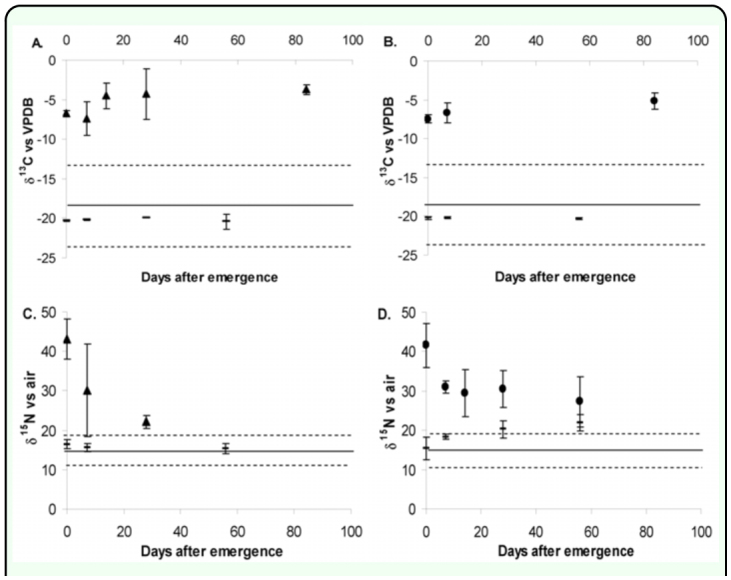
Figure 3.

Average isotope values of laboratory reared labelled G1 tsetse flies Glossina pallidipes (13C triangles, 15N filled circles) and control un-labelled flies (short bar) at various times after emergence, error bars plus and minus two standard deviations (n = 3–5). The solid line represents the mean isotopic value of the wild population and the dashed lines, plus and minus two standard deviations of that mean value. A and C are females; B and D are males. High quality figures are available online
