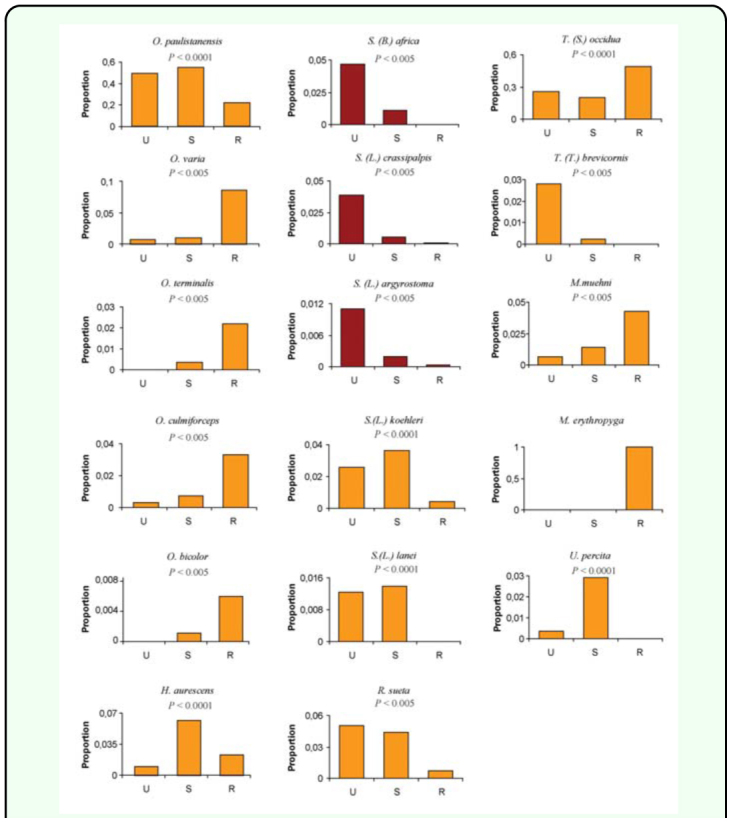
Figure 6.

Proportion of Sarcophagidae species to total flies captured for the different sites in the urban-rural gradient during the study period. P values account for differences among sites according to the Chi-square test for independent proportions. Orange and red colors represent native and exotic species, respectively. U = urban, S = suburban, R = rural. High quality figures are available online.
