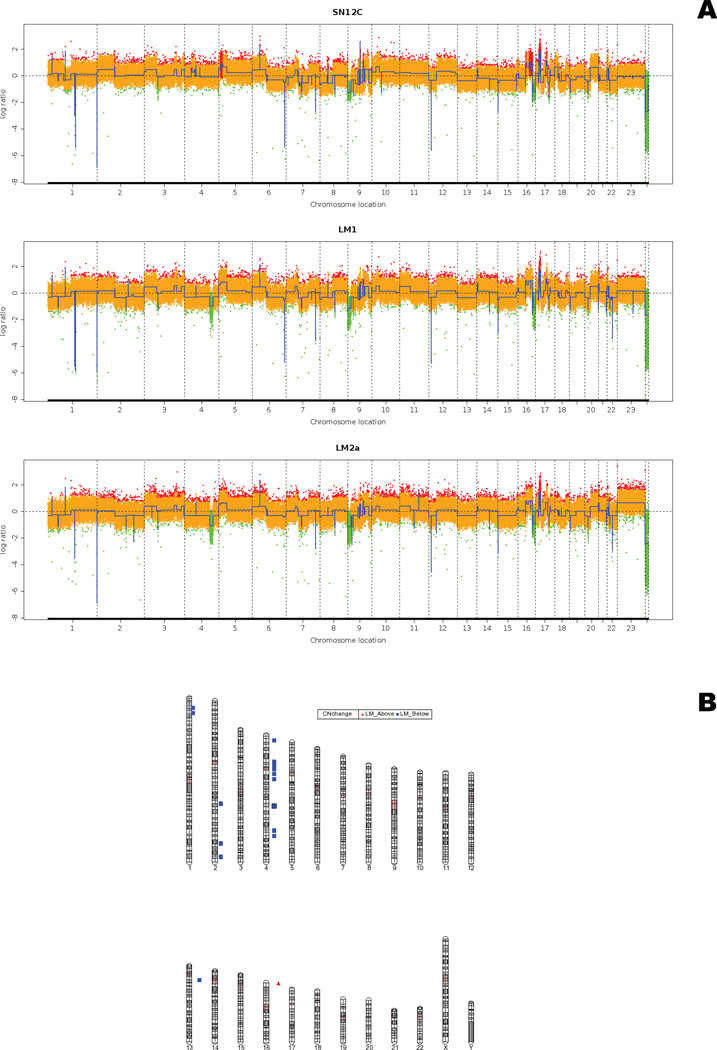
Figure 3. DNA copy variation.
(A) Segmented copy numbers for each cell line were inferred with the GLAD (gain and loss analysis of DNA) algorithm and normalized to a median of two copies. Vertical dashed red lines represent the breakpoints detected with GLAD and the assigned statuses are indicated by a color code: green for loss, yellow for normal and red for gain. (B) Chromosomal mapping of regions of copy number alteration. Regions appearing increased in copy number are shown in red, and those decreased in copy number are shown in blue.

