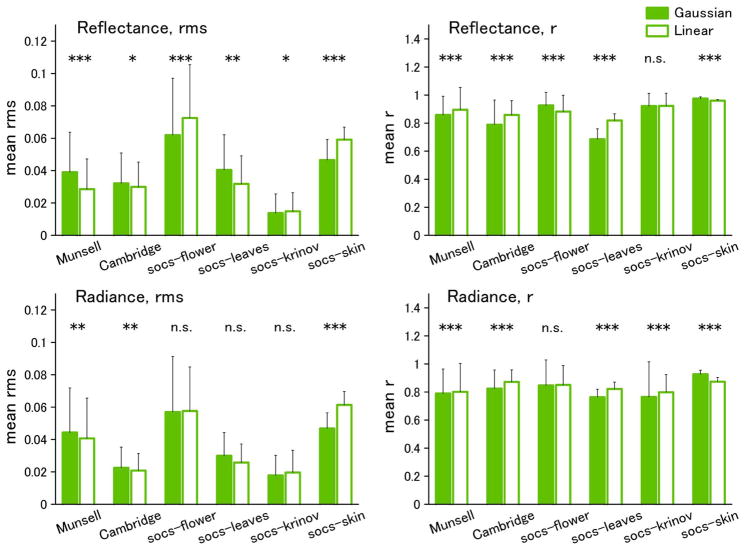
Fig. 3.
(Color online) Results of Gaussian and Linear fits to reflectance databases. Left panels, mean rms error; right panels, mean correlation coefficient (r). Error bars indicate standard deviation within each dataset. Significant differences between the linear and Gaussian fits are shown by the symbols above the bars [*(p < 0.05), ** (p < 0.01), ***(p < 0.001)].

